
Production Performance
Performance You Can See & Control
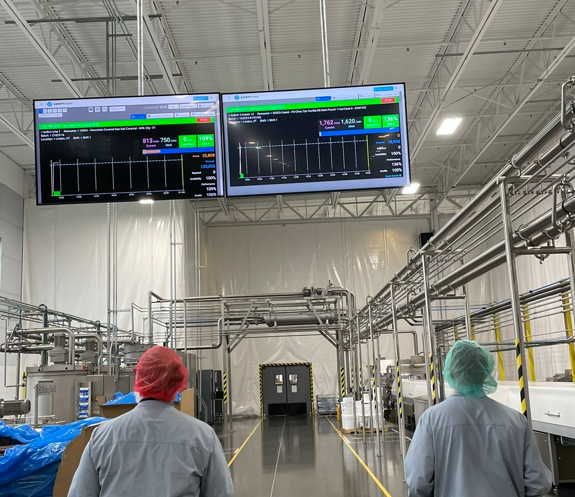
SafetyChain connects live production data — throughput, downtime, yield, and scrap — with the quality signals that explain why performance changes. Operators and supervisors get visibility into what's happening in real-time, so they can catch drift early instead of discovering it after the shift ends.
Proven Gains on the Production Floor
$20M in Yield Gains
50% Overpack Reduction
$5.4M Scrap Savings
More Stable Production Runs


One System to Track Performance & Resolution
- Real-Time Line Performance
Monitor throughput, downtime, yield, and scrap live in the Operator View, with downtime automatically logged by source and reason as conditions drift. - Quality-Driven Performance Signals
Use in-process checks, control points, and SPC trends to identify quality-related conditions that disrupt performance. - Corrective Action Built In
Link deviations directly to corrective and preventive actions with clear ownership, tasks, and verification, so issues are resolved, not just observed. - Shift and Line Comparisons
Identify variability across shifts, lines, and locations using the Run Summary View, which consolidates active and completed runs on a single screen for production leadership.
Fix Problems Before Output Suffers
Production issues often start small and compound quickly when teams lack visibility. SafetyChain helps teams stay ahead of performance loss during the run, and prevent repeat issues after the shift ends.

Earlier Intervention
Better Operator Decisions
Reduced Unplanned Downtime

Consistent Performance Across Shifts
Serious Production Insight and Execution (Minus the Overhead)
- Real-Time Production Monitoring
Track throughput, yield, waste, downtime, and other KPIs through dashboards operators and supervisors rely on during the shift. - Connected Quality and Production Data
Analyze production performance alongside quality indicators to understand how operating conditions affect output and compliance. - Statistical Process Control (SPC)
Detect variation early and trigger corrective actions before limits are breached or product is lost. - Automated Alerts and Workflows
Assign tasks, escalate issues, and verify corrective action when production or quality conditions require attention, without manual oversight. - Flexible Data Integration
Bring in data from ERP, MES, and equipment using APIs and SafetyChain's Ignition module without fragile, sensor-heavy deployments. Push production plans directly using the Production Run API, removing manual entry as plan volume grows. - Actionable Reporting and Analytics
Create reports and dashboards that support continuous improvement while maintaining a clear, defensible record of what happened and how issues were resolved.


Trusted by Food & Beverage Manufacturers

How Fresca Integrated Quality and Production Systems to Keep Up with Growth
Like many food companies, production and quality are critically important functions in the overall operations of Fresca Mexican Foods. While the two are closely related in many ways, they are sometimes disparate groups with their own unique priorities.
Plant Impact Spotlight: Freshpet
Freshpet competes with bigger brands by providing high-grade, consistent food for pets, earning customers' trust. Real-time data is crucial for plant performance, ensuring food safety, and saving supervisors hours of time.
Build Stronger Production Performance With SafetyChain.
Related Blog Articles on Production Performance

Using OEE Software to Drive Measurable Improvement
Implementing the right OEE software can be the difference-maker. Learn about how choosing a software platform like SafetyChain can deliver valuable insights.

Continuous Improvement in Process Manufacturing
In this blog, learn how OEE has revolutionized the manufacturing industry and how you can put it to work in your facility.

Optimizing Your Process and Product
Read this blog to learn how you can move beyond specification to improve quality and productivity across your plant.